About the Project
I started putting this together when my friends were wondering who was the most active on our Facebook group chat. The chat in question has 14 participants with 80,000+ messages going back more than 4 years. Once I’d answered the obvious questions, it wasn’t long before this turned into a larger project.
If you have any questions/suggestions for the project or have found anything interesting in your own group chats please get in touch!
To get started right away with analysing your own group chat, look at the getting started page and check the documentation page if you get stuck. Otherwise, there are a couple of examples of easy things you can do below.
Example Analysis
To show off the various features of the project, I’ve gone through my own group chat and found a couple of interesting things. The names have obviously been changed throughout.
User Rankings
On loading the chat we can straight away look at who posts the most:
>>> groupchat.message_rank()
Linwood Zook       21610  26.00%
Mitchell Ashworth  17929  21.57%
Diedra Devane      13538  16.29%
Genaro Eggleston   10650  12.81%
Erna Claypool      6162   7.41%
Harold Culligan    3914   4.71%
Lester Sneed       3739   4.50%
Melissia Dubiel    2478   2.98%
Wilburn Malbon     1213   1.46%
Maryann Peguero    942    1.13%
Ashanti Sankey     486    0.58%
Evelin Boden       420    0.51%
Hai Cruzan         24     0.03%
Irwin Alm          8      0.01%
This wouldn’t be a huge surprise to anyone in the group chat… two users account for almost half of the activity on the chat. Apart from the bottom 2 users, everybody else’s messages are well spread throughout the three years of data so I thought it was worthwhile to include everyone as I moved on.
Usage Over Time
First we’re going to look at the activity of the entire group…
>>> groupchat.time_plot()
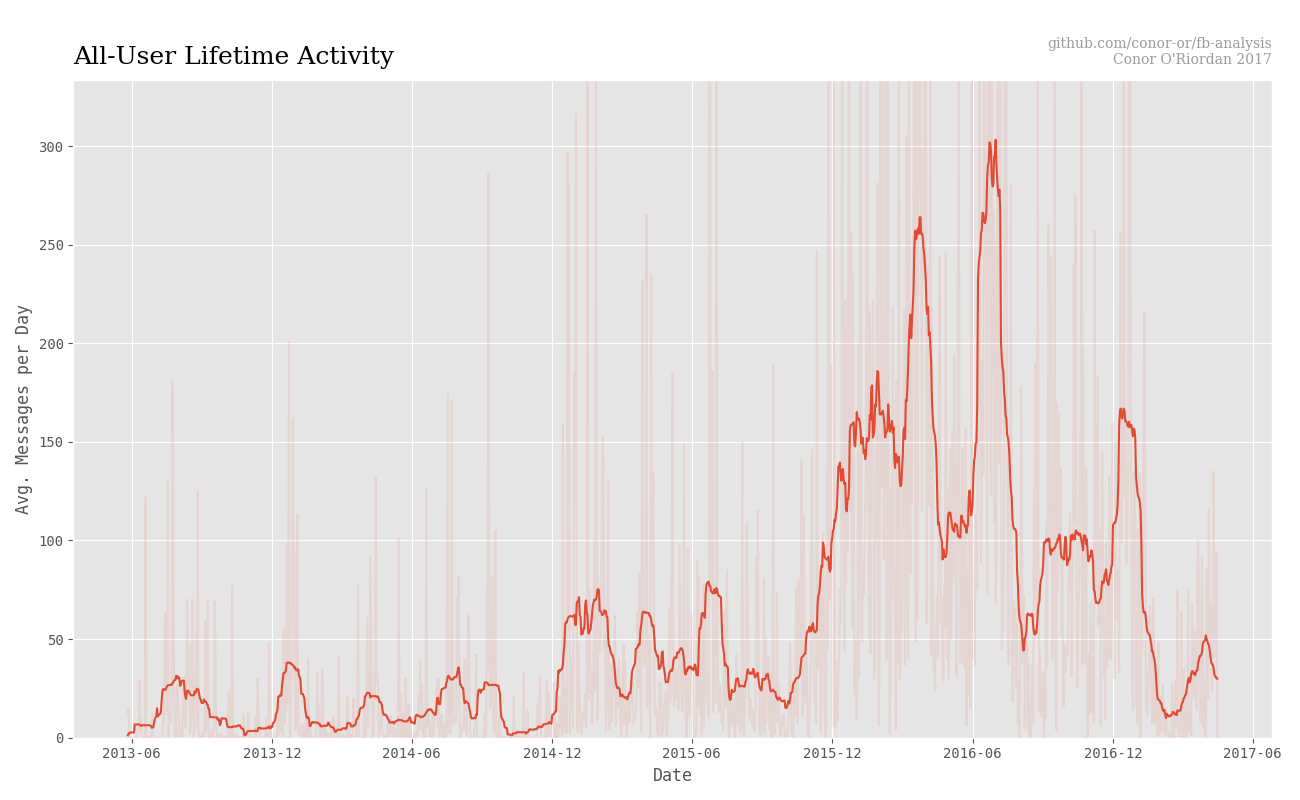
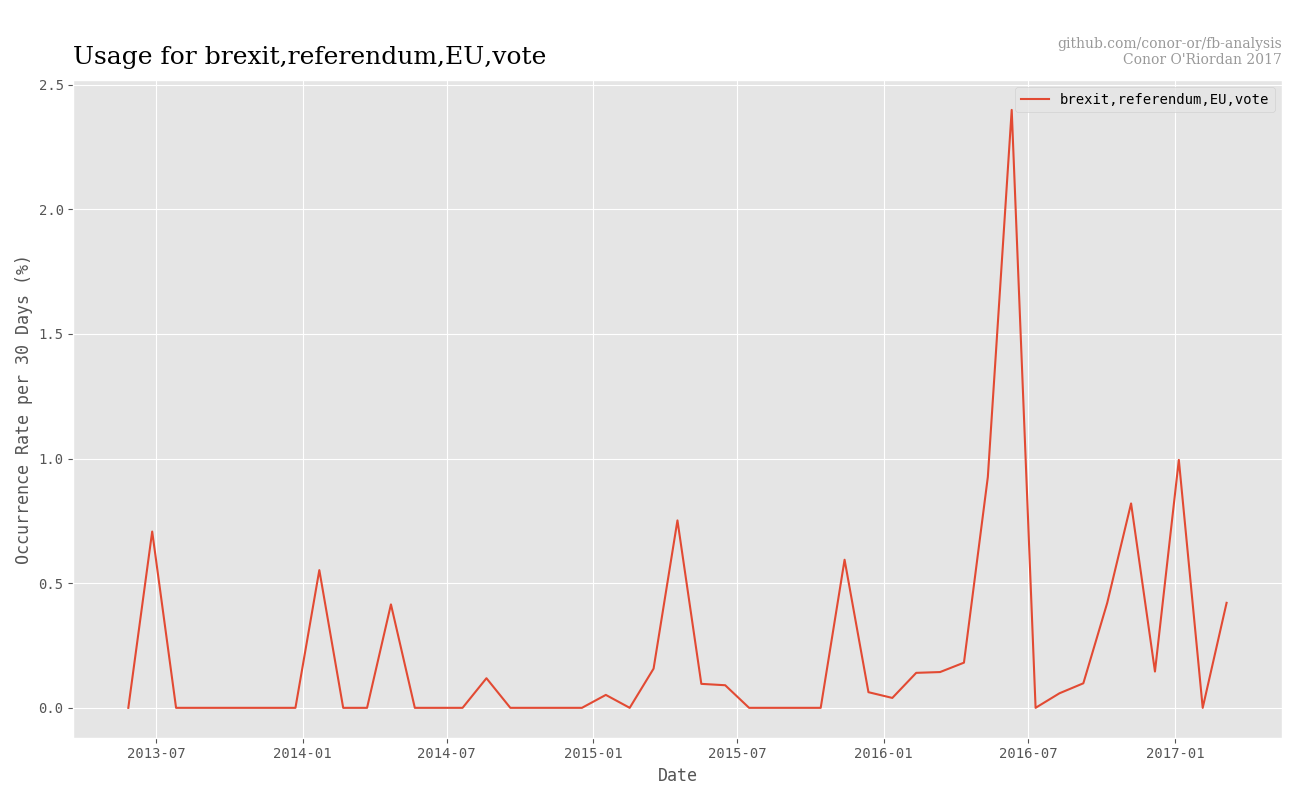
We can see obviously that activity has varied massively over the years. There are repeated jumps in activity in Dec/Jan, when people are home for the holidays. At its peak activity in June ‘16 the group chat averaged 300 messages per day for a short period. This actually coincides with the EU referendum here in the UK. We can check if that’s the case by plotting specific word usage…
>>> groupchat.word_plot([['brexit', 'referendum', ' EU ', 'vote']])
Individual Activity
We can also do the above for specific users to see how individuals have used the chat differently over the years. We take the top five users from the rankings…
>>> groupchat.time_plot_user(['Linwood Zook', 'Mitchell Ashworth',
                              'Diedra Devane', 'Genaro Eggleston', 'Erna Claypool'])
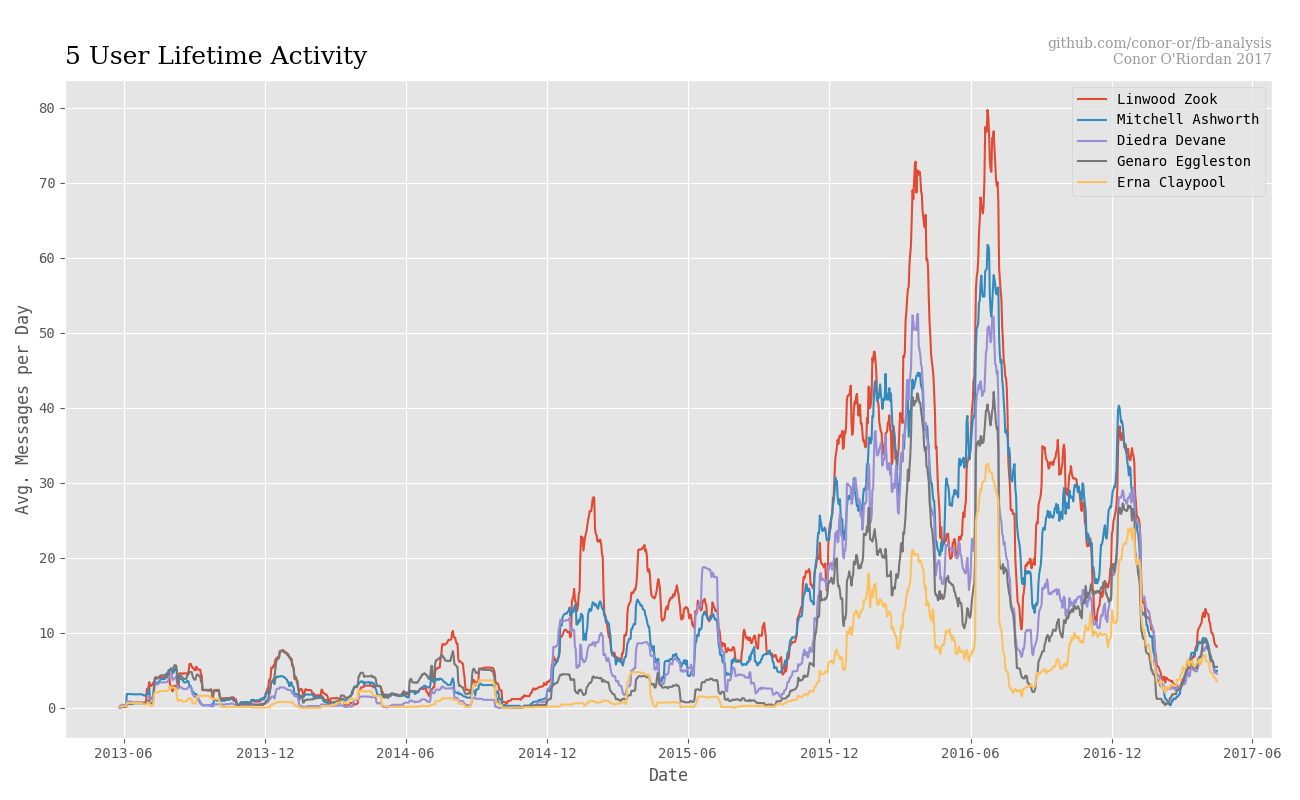
We can see long periods of time where different users don’t appear to track each other that closely, although all rise and fall with the general trend of the group. Some sort of correlation/convolution of each user’s activity with that of the group’s might be able to show this better.
Daily Activity
If we just collate the times of all the messages and ignore the dates we can get a picture for the how the group behaves over the course of an average day…
>>> groupchat.daily_plot()
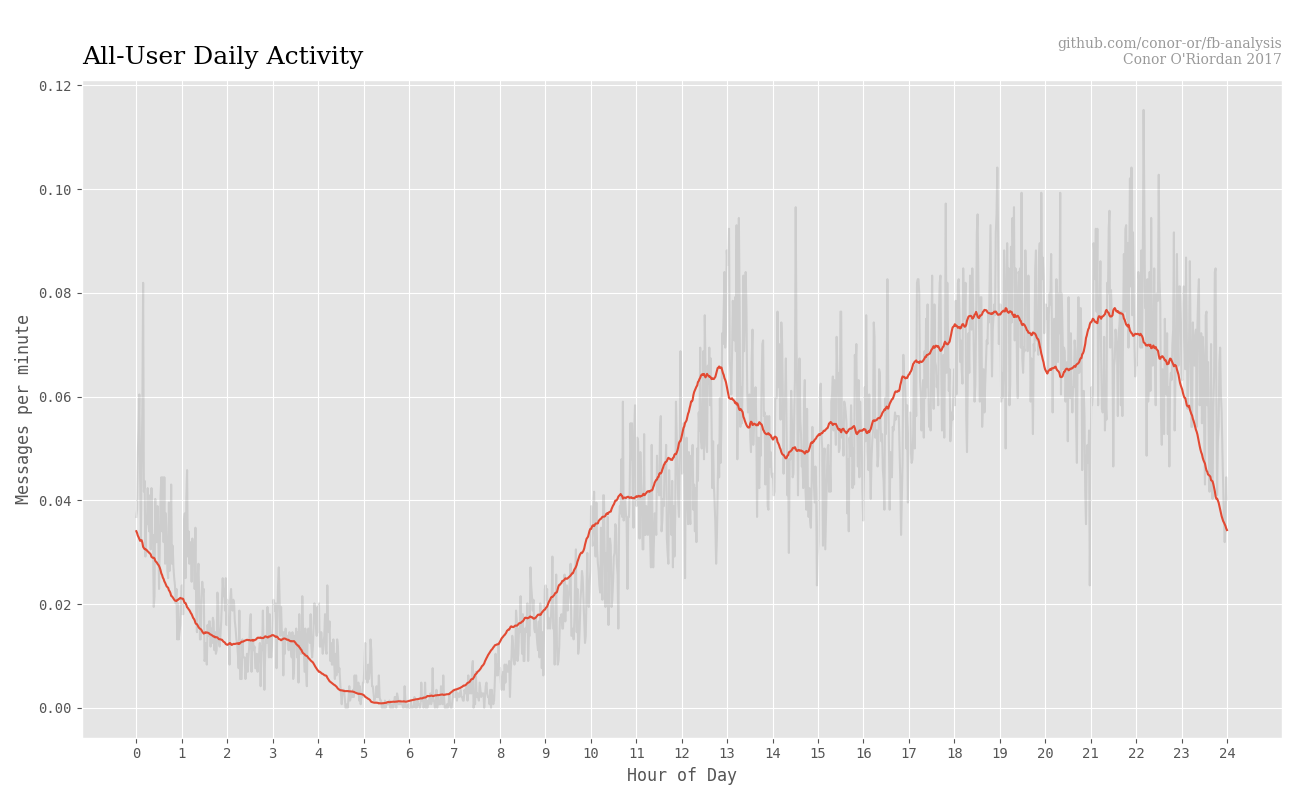
We can see a fairly smooth sinusoid covering the whole 24 hours, interrupted only by meal times; a jump in activity at lunch time and a decline in activity around dinner time. During the night there’s also a slight increase in activity around 2:00 to 3:00 am that I’m not too sure of.
Just like the lifetime activity, we can break the daily activity down by user as well…
>>> groupchat.daily_plot(names=['Linwood Zook', 'Mitchell Ashworth',
                                'Diedra Devane', 'Genaro Eggleston', 'Erna Claypool'])
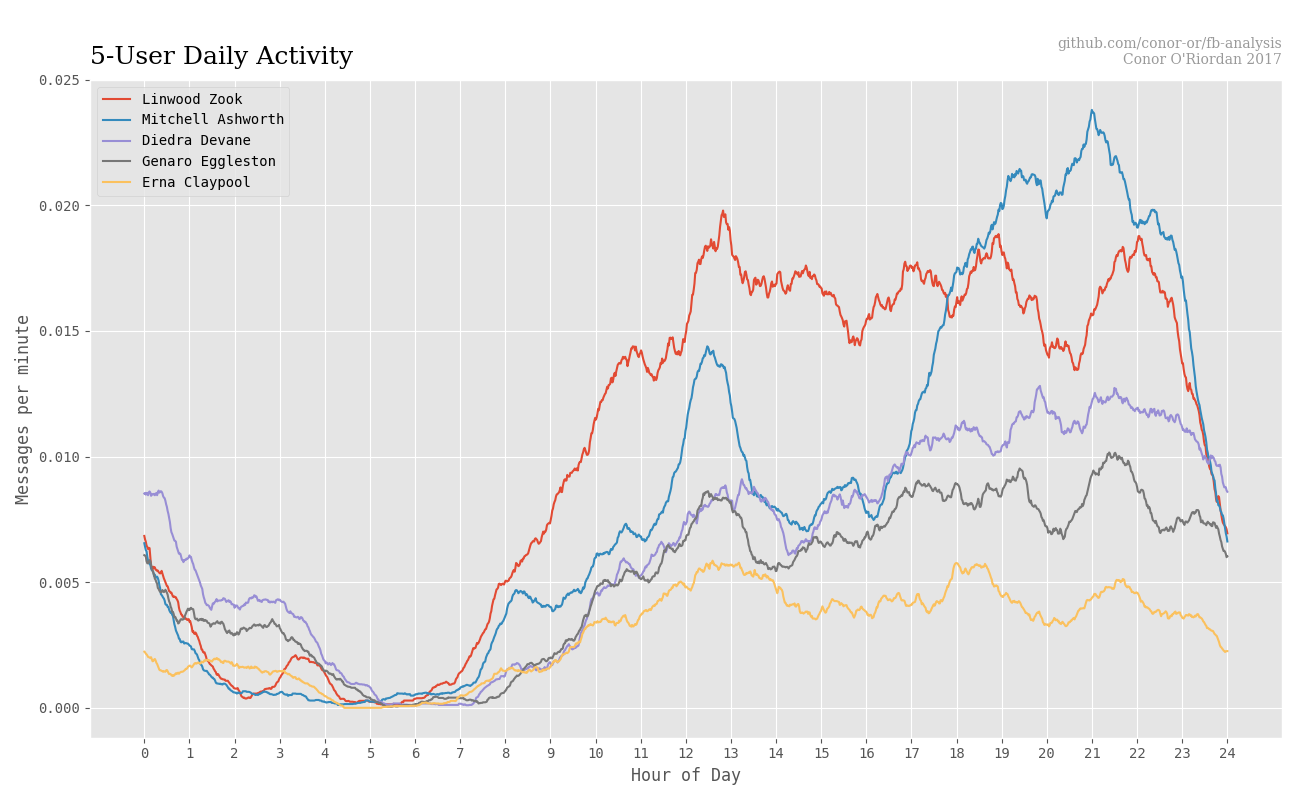
This shows us quite large differences in the average day of each user. For example, Mitchell Ashworth hardly sends any messages while he’s at work and then massively jumps in activity in the evenings.
Weekly Activity
The same as the above can be done for each day of the week alone and then put together to see how the group behaves over an average week…
groupchat.weekly_plot()
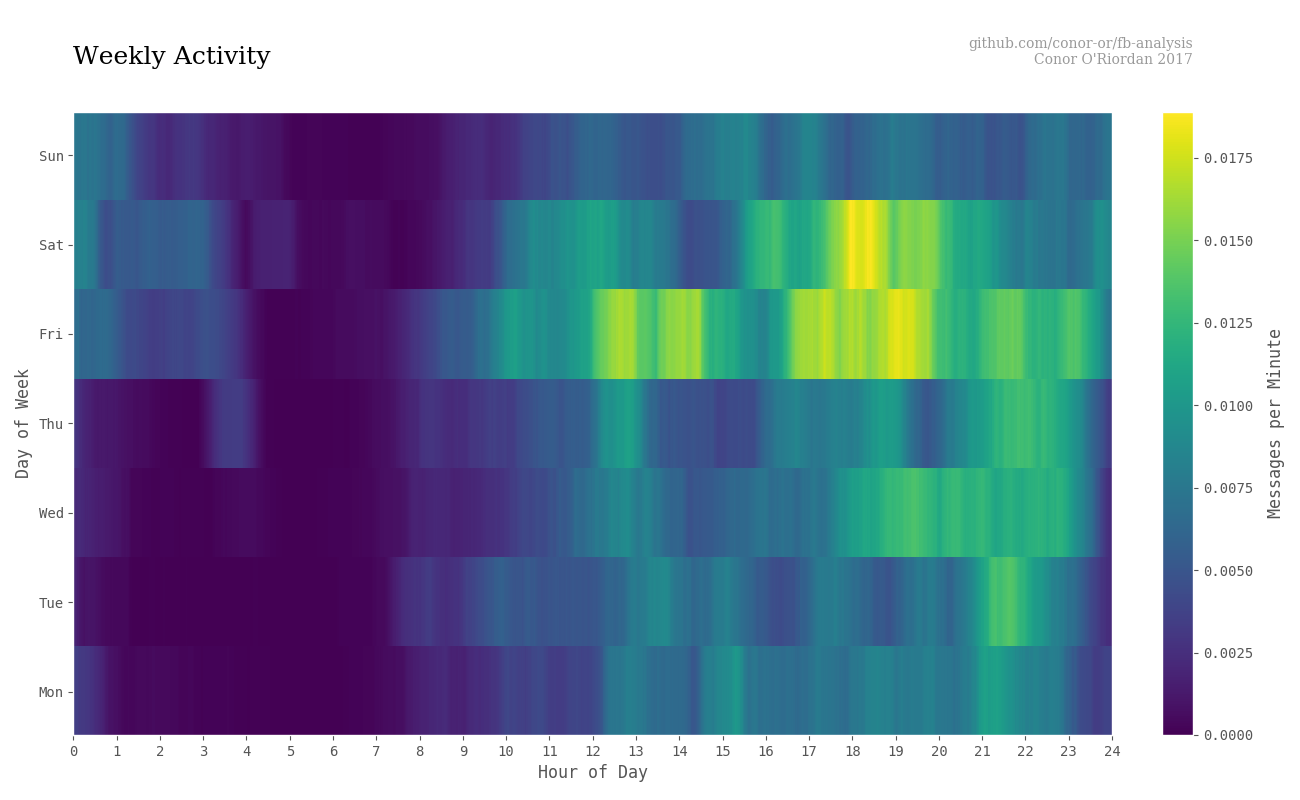
Here we get a sort of heatmap for weekly activity. What stands out straight away is that Friday and Saturday early-evenings are the most active. There’s little difference in activity among the weekdays, although Wednesday (for some reason) has a much higher activity than other weekdays at the same time.
Conversation Matrix
Here’s one that might take more tailoring to individual groups. First we define a conversation to be a chronological set of messages bounded by some gap in time, let’s say 30 minutes. Every 30 minutes without a message then defines a new conversation.
Now we take a matrix with a row and column for each group chat participant. Then for each conversation we’ve found, we add a point to the matrix entry between that conversation’s members. At the end we divide row-wise by each participant’s total message and normalise so that rows add to 1.0. Diagonal entries are set to zero.
The below then gives us an idea of who most actively talks to who within the group chat.
>>> groupchat.matrix_plot()
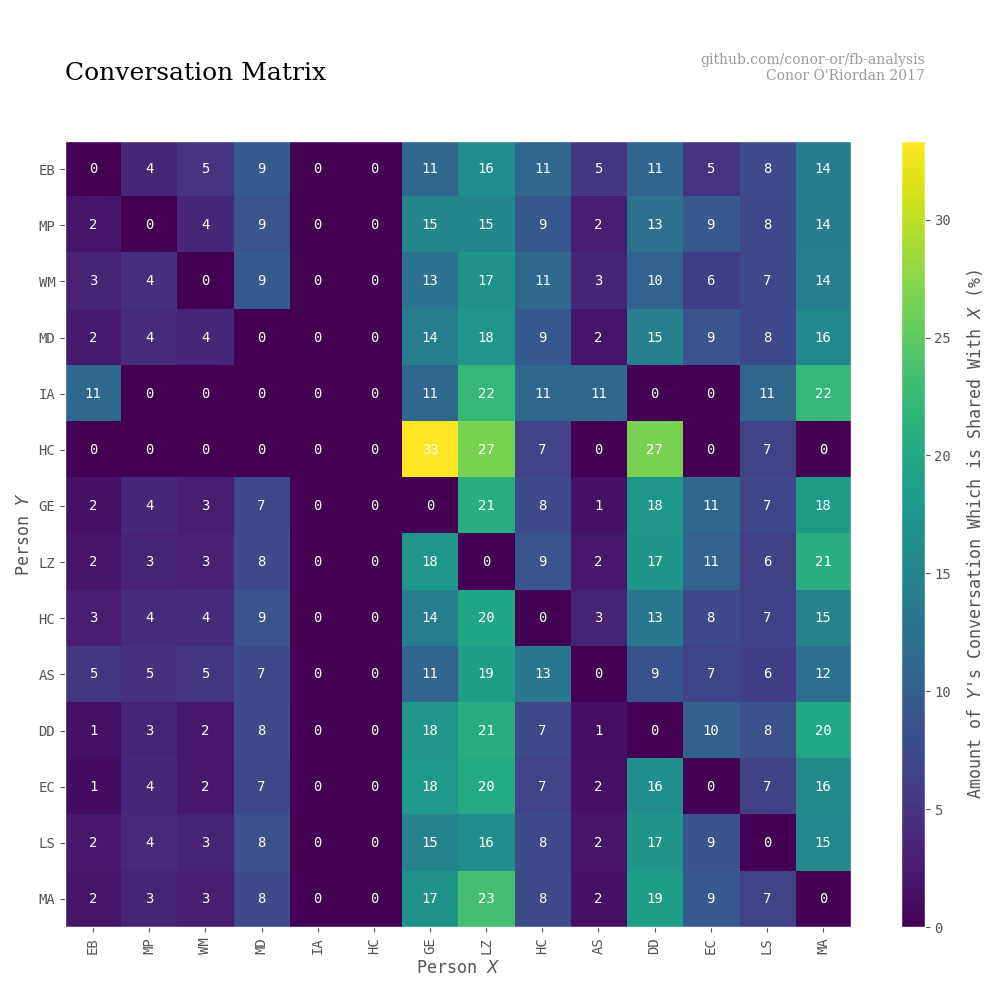
The number in each square represents the percentage of Y’s conversations which involve X. To claim it as an actual percentage I think some work needs to be done on the normalisation, but I do think the values make comparitive sense. For example, it’s probably valid to say something like ‘AS speaks to MA more than she speaks to LS, but neither as much as she speaks to LZ’.
If the normalisation can be improved, this matrix could be used to constuct graphs with people as nodes and the matrix values as edges.
Now have a go at analysing your own group chats! Get started here
Conor O’Riordan, Apr 2017
All credit for the data goes to JT, SB, LS, LS, TB, TM, MC, PR, JDC, JR, MMN, DK and AF.